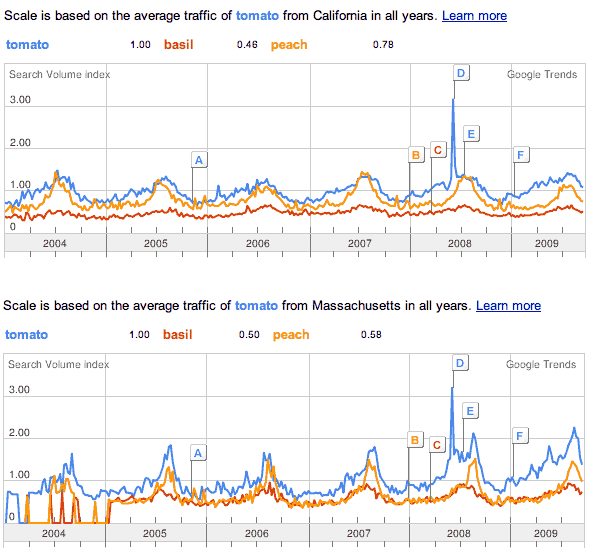
I’ve been looking at seasonality in foods, and realized Google might have the answer. It’s so rewarding to see theory line up with data!
California users are shown on the top graph and Massachusetts users are on the bottom. Note the difference in amplitudes: the growing season in Massachusetts is much shorter than in California, so it follows that searches for perishable ingredients would trend up and then back down over a much shorter time period.

(The spike in June, 2008 – “D” – is from the Salmonella scare.)